 This week I had an opportunity to speak with Brian Sullivan on CNBC’s Trading Nation (see also Media) and discuss a couple of charts. In the interview I mentioned that from our perspective we are in the final wave of this bull market: “We’re coming from a point of view that we’re in this kind of final wave of this bull market, and the market is transitioning from a ‘buy the dip’ to kind of a ‘sell the rip’ environment”.
I wanted to expand on the interview and the charts in a bit more detail to give additional context. To regular readers it’s of course not a surprise that I am structurally bearish and I had outlined the case in detail in February in The Coming Bear Market with a clear view that tops are processes.
And before I get any grief from “wavers’ for using the term “wave” I use the term as an allegory and not a technical term. I’m not a “waver” nor do I declare myself to be one :-).
Why a final wave of the bull market?
I won’t run through the details here, but the key arguments summarized briefly:
a. Vast technical disconnects on key index and stock charts demanding reversion, or reconnects with key moving averages. For example $NDX managed to be 21% above its annual 5 EMA this week. I’ve outlined them here in Disconnects.
b. Structurally high debt loads are in essence pre-programing the next recession as consumers are already showing increased growth in credit card defaults, subprime auto loan and student load defaults before rates have even substantially increased and overall loan growth is slowing. These issues will limit consumer spending if productivity growth and real wage earnings can’t expand. As of now disposable income growth is slowing.
There are a number of data points that show concerning trend changes already on this front. I’ve outlined some of these in March Macro Charts.
c. Sentiment has radically shifted since the election lows from the “most hated bull market” to vast optimism as reflected by numerous surveys but most importantly fund flows into passive ETFs. As I’ve outlined previously retail has loaded in long at very high valuations based on promises of more free money in the form of tax cuts, infrastructure spending and deregulations to come.
In November I’ve outlined my view that many of these promises would turn out to be Empty Promises as structural realities would demand answers.
The political environment in the US is extremely toxic at the moment with vast segments of the population seemingly unable or unwilling to even want to agree on a common reality. It seems unlikely that political common ground can be found in the near term. Indeed, yesterday Republicans couldn’t even agree amongst themselves on their own version of healthcare. While I won’t go into the merits of policy I think it’s fair to say that this new version was not supported by a vast majority of Americans and resulted in a policy disappointment versus what was promised during the election and since.
This failure serves as a reminder that the high levels of optimism built into markets may not pan out. Call it another reversion to the mean in the cards which brings us to the next point:
d. Valuations are far above the mean of recent years: GAAP P/E’s are 33% above the 6 year median and forward P/E’s are 28% above the 10 year average. That’s a lot of optimism and just a reversion to the mean suggests sizable downside risk and our thesis remains that the totality of the factors outlined above will greatly contribute to a future corrective event of size not seen in many years.
In the interview I also mentioned a highly bifurcated market. Primarily large cap stocks, with emphasis on outperforming tech stocks have been driving the indices higher while we have seen considerable relative weakness underneath: Year to date we can note these select performances:
Indeed small caps haven’t gone anywhere since the initial price burst following the election:
This strength in high cap tech stocks (and they are not alone) in particular has very much masked the relative weakness underneath hence volatility remained very much compressed. My assertion has been that such low volatility is not a long term sustainable proposition:
$VXO = 9.60.
Doesn’t stay this low for very long. pic.twitter.com/YrrjMuyAxn— Sven Henrich (@NorthmanTrader) March 15, 2017
And as of Friday we can indeed observe an uptick in volatility:
In this week’s interview I talked about “rounding bottom” patterns in the $VIX along with a descending trend line on the $VIX:
Indeed on Friday the $VIX broke to new highs for 2017 but was rejected at the 200MA as it did the last time it tagged it in December of 2016:
Principally our view remains that the upper trend line will at least get tagged in 2017 and the related open gaps will get filled. This is the 17-22 zone on the $VIX and it may well be a defining zone for markets this year. It may be a buying opportunity initially and produce a sizable rally as the previous tags did. At the same time it should be noted that a sustained break above the larger trend line would represent a seismic shift in the volatility regime of this market.
Zooming in on the shorter time frame we can observe that the smaller trend line has been broken to the upside this past week:
Whether a retag of the lower trend line is in the cards I can’t say, after all several sectors are now oversold producing charts like this:
Indeed this chart alone suggests that a bounce is in the cards.
Short term there remains risk for further downside. Indeed when $SPX printed its highs I posted a structural chart that highlighted the complete lack of any real corrective action in markets since the election suggesting downside to develop:
Something to ponder.$SPX pic.twitter.com/w76QuPehL7
— Sven Henrich (@NorthmanTrader) March 2, 2017
This chart still applies and leaves room for lower price action:
As does a view of the longer time frame:
What these 2 charts above clearly show is that nothing has broken in these markets yet, but that short term sizable corrective risk remains. In conjunction with the $VIX chart that remains a viable set-up. However, there has been no real roll-over in tech yet and many stocks are already oversold on many levels.
Consider $GS as an example:
So markets are at an interesting juncture here. Short term oversold in some sectors and stocks, yet vastly technically disconnected to the upside in others with volatility still remaining historically low. As I stated: Bifurcated.
Short term then further corrective risk of size remains, but the upside equation can’t be ignored either especially as April seasonality tends to be positive. And coming from the perspective that we view markets as a sell the rip opportunity we need to be cognizant of potential upside risk as well.
Which brings me to the 1987 trend line chart and upside risk I discussed on Trading Nation.
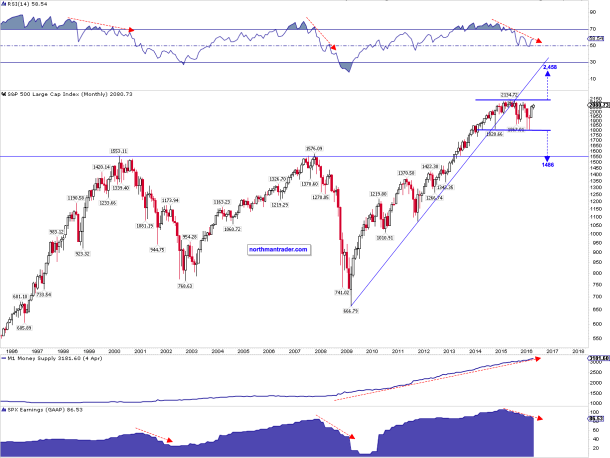
In my 2017 Market Outlook I highlighted a chart from April 2016 which pointed to a price extension risk into 2458:
This price extension risk still remains. Indeed a similar exercise using the 2007 highs and 2009 lows as a range yields a target slightly higher:
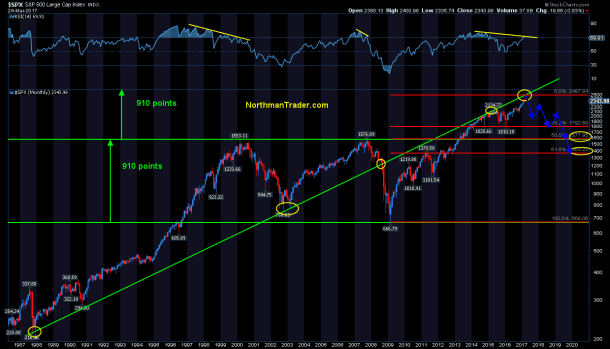
Mind you this does not mean price MUST get there, but it’s technically certainly possible, as is the trend line I outlined on CNBC dating back to 1987:
This is actually a pretty good trend line for bulls as it keeps rising of course, hence the later price were to get to there the higher markets may extend. The bad news: If this trend line has market relevance (as it appears to looking at its history), then it suggests the following:
$SPX broke this trend line in 2008/2009. And despite vast global central bank intervention as well as building a global debt load to the tune of over $152 trillion, markets remain below this long term trend line. It’s still technically broken.
So taking these charts together we view current upside risk to be confined to the 2450-2500 zone on $SPX (or about 3.5%-4% higher from current highs) where multiple price range extensions and major historical trend lines are representing major confluence. Does not mean price gets to there, but it represents technical risk.
What’s the ultimate vision of all this?
Well, from our perspective these markets remain completely uncorrected in any historic sense since the 2009 lows and, whether one wants to acknowledge this or not, a recession is coming. Indeed a reversion to any mean, be it technical, price or sentiment or altogether may accelerate the timing of a coming recession.
And don’t think the Fed is not aware of this, hence you get nuggets of truth on occasion. Consider Fed governor Bullard this past week:
BULLARD: YOU’D SEE WEAKER EQUITIES IF FED GETS TOO AGGRESSIVE
— zerohedge (@zerohedge) March 24, 2017
Can’t have that.
And a coming recession will likely be the proximate cause for the Great Unwind suggesting very sizable downside targets to come based on basic fibonacci levels alone. Here’s a completely speculative view how this could structurally resolve, whether from here or from the higher risk levels outlined above:
None of this is technically outlandish, yet participants no longer consider corrections of size viable speaking again to the extreme optimism permeating markets. Well, I’m no longer calling for a correction, I’m outlining the elements of a major bear market emerging over the next couple of years.
And if you are looking for capable political leadership to implement practical solutions that help avoid a recession, the events of the past week should give anyone reason to pause whether you are a supporter of the administration or not. My view remains: We are facing huge structural issues in the economy and neither political party has proven itself to be willing and/or capable to address them. Indeed, they may not be fixable without a massive re-alignment first.
One final thought: Next week not only the month, but also the quarter ends and price closes at that time will be of interest to technicians as potential rejection candles are worth watching.
We recently saw one on the weekly $SPX chart:
Fyi: Weekly rejection candles don’t need to be red in uptrends or particularly large, but can be consequential.$SPX 14% above weekly 100MA. pic.twitter.com/cYFWYXZeOE
— Sven Henrich (@NorthmanTrader) March 4, 2017
And indeed so far it has followed the historic precedence:
And a look at a current quarterly chart highlights that a larger rejection handle is something bulls may seek to want to avoid:
Note the large price disconnect away from the quarterly 5 EMA. Reconnects happen frequently as the chart suggests, if not in this quarter then the next. But as the chart also highlights: That supporting trend line is steep and a break below is a question of when, not if.
For the voiceover see below:
Categories: Market Analysis


8 replies »