 As 2014 comes to a close I want to share our key learning from this year that is informing our trade strategy for 2015 and maybe the reader will find it useful as well. The main message: Filter out the noise and focus on identifying market structures and trade them with conviction but with using stops.
I’ll use the last couple of months of market action to crystallize the point and I’ll highlight my own self critical introspection in the process to draw the lesson out:
Back in mid October during the peak of the corrective action I highlighted a strong case for new highs being a distinct possibility and offered this chart on October 16 in Shades of Grey: 2007 Edition:
As we now know markets moved straight up without a retrace and even exceeded the megaphone trend line rendering the lower move seemingly moot. The primary operational culprit for the massive levitation act ended up being the unprecedented global central bank action with massive up gaps induced by the BOJ, the PBOC, and the ECB and I freely admit they threw me for a loop as well. The flat tight range action was tricky to trade and despite realizing the price action was most likely exaggerated my conviction was tested as well.
Yet the main lesson here: While central banks may have exacerbated the slope and speed of the move the target was in the chart and the upper trend line the magnet. My mistake: Exiting too early.
In October NorthmanTrader merged with KissTrades and the goal has been to blend the skills & strengths of an aggressive day trader with that of a best in class swing trader. Mella_TA has been making the big structural calls in our member feed ever since and all of us are have come to appreciate her KISS strategy: Keep it simple, stupid. I’ve outlined some of her charting capabilities and methods here in Weekend Charts: KISS.
Don’t get me wrong, day trading can bring out fantastic returns, especially in volatile markets and there is no reason not to take advantage of it, but the big structural swing calls can be extremely profitable and the charts more often than not do tell the tale.
The latest example:
In recent weeks we’ve been pointing out weakening internals despite the bullish noise going in overdrive. Last week’s Barron’s being symptomatic by proclaiming that this time is different:
Instead we offered this chart on December 6 in “Weekend Charts: Weak Foundation” suggesting a repeat of the previously seen corrective structures:
This chart was based on the structural call Mella offered in the member stream on Dec 2:
Here is what this chart looks like exactly one week later:
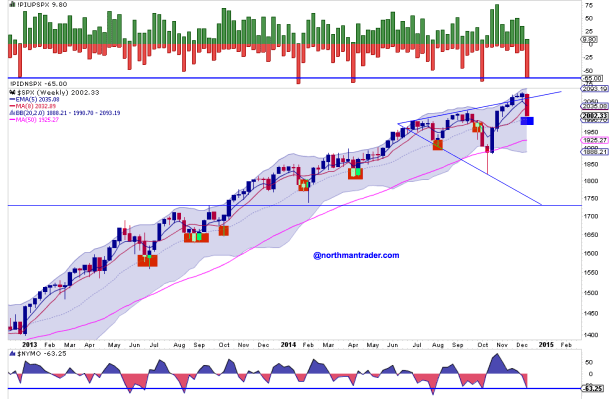
The big lesson: KISS. The charts tell the tale, stick to your convictions and filter out the noise. While everyone on twitter and CNBC was busy pointing out positive seasonality for December and retail flushed into the market as evidenced by record high ETF inflows, all were promptly rewarded with the largest weekly decline of 2014.
So now a bunch of people are trapped above as most of the central bank encouraged price action has been completely reversed. In fact 25 trading days worth of price range has been taken out in this past week alone:
That’s a lot of people now really NEEDING a Santa Claus rally. Remember the argument was all about performance chase and funds lagging.
But what do the charts say?
The weekly $SPX chart may actually point to a simple structural repeat of all recent corrections:
And right here is where it’s getting interesting. I can make a really convincing chart case for a massive bullish outlook for 2015 and also a massively bearish one.
Are you ready?
Let’s start with the bullish one. Have a close look at the $NYSE. It recently failed at new highs, but it is now vastly oversold and is also looking to put in a massive inverse heads and shoulders pattern:
This chart would be perfectly compatible with the 1999/2000 blow-off scenario we have been watching and discussing in “Crescendo“:
The flip side, and the very bearish case, is now a very apparent replay of the 2007 structure that is evident in the $WLSH:
And behold we have a monthly MACD cross-over.
But good news though: Janet Yellen has the forum this week, OPEX tends to be bullish and December markets tend to seasonally bottom around the 13th or 14th trading day of the month.
So bulls have a solid chance to turn this all around before the end of the month.
What’s my strategy? Simple, I’m executing our 2015 strategy: Day trade the action aggressively, pay very close attention to Mella’s structural swing calls and trade them with conviction and stops in place.
If you would like to join us for this journey ahead more information can be found in the About and Membership pages.
Categories: Market Analysis


Awesome bllog you have here